From these datasets, what are the key metrics you would want to look at when monitoring game health on an ongoing basis? For each of these metrics, make a graph that shows how the metric has changed over the 3 month period included in the datasets
The key metrics I would use to evaluate the performance of the app are listed below. For the analysis and visualization, I have used a combination of R and Excel.
DAU/MAU Ratio
The DAU/MAU ratio defines the stickiness of an app. This metric tells us for how many days in a month is the average user active in the app. For the purposes of this assignment, I have defined an active user as someone who has pinged/opened the app. Other potential definition of active users could be a user making a purchase, having more than an x amount of pings a day, etc.

The red line shows the regression line with the shaded region representing the confidence interval. The ratio varies between 15% to 22%.
Retention
The retention rate tells us how many users keep coming to use the app after they install the app. The chart below shows the retention rate for 1 to 7 days and 30 days since they first installed the app. For sake of brevity, I have only listed the retention rates for some of the days.
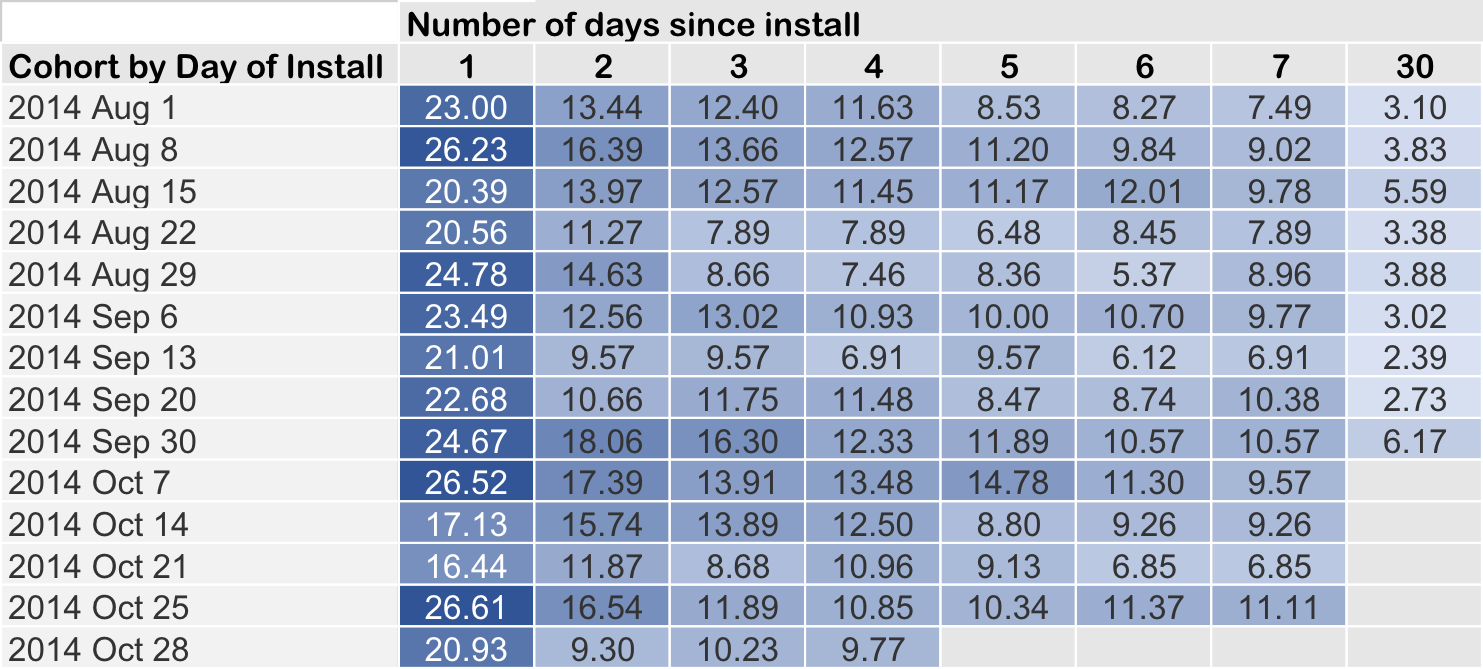
The Day 1 retention rate is between 16% to 27%, for Day 7 the retention rate is between 7% to 11 % and for Day 30 it is between 3% to 7%.
Conversion
The conversion rate tells us how many percentage of our daily active users are making a purchase. The chart below shows the daily conversion rate for new users and returning users across the 3 months.
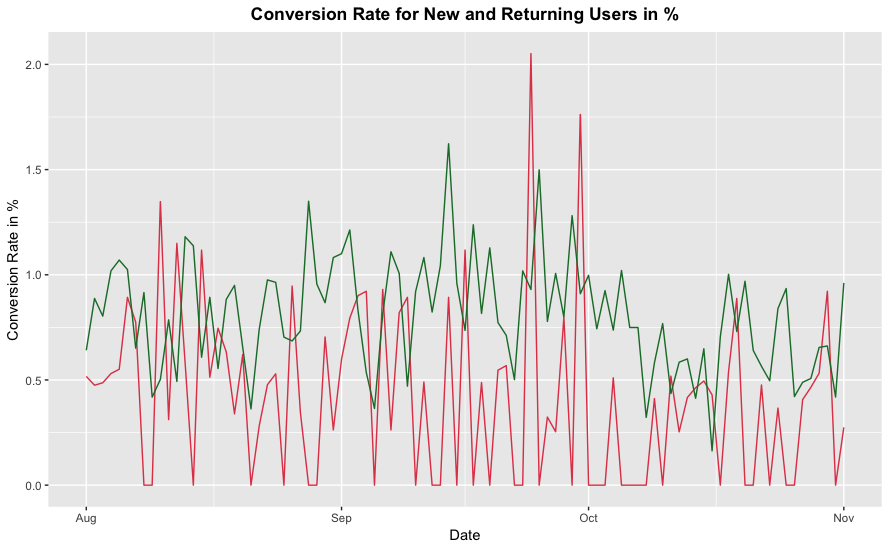

As is expected, the conversion rates are mostly higher for returning users over new users. The conversion rate for returning users is around 0.4 to 1.5%.
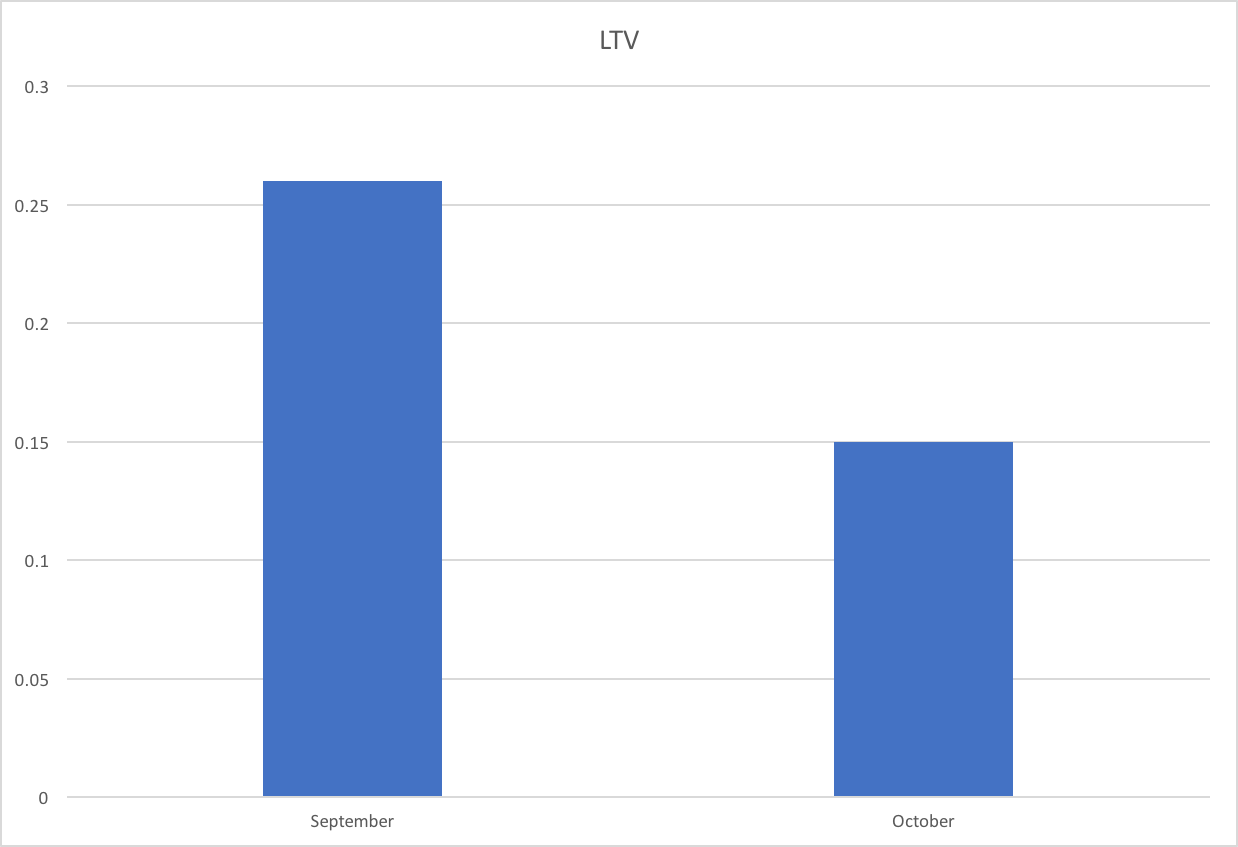
LTV (Customer Lifetime Value)
While there are many ways to calculate the LTV, I have used the following formula:
LTV = ARPU * (1 / Churn)
where: ARPU = Average Revenue Per User Churn = Percent of customer lost over a given period.
For the month of September, ARPU = 19.03 cents/user and Churn = 72.51% and hence LTV = 0.26 For the month of October, ARPU = 10 cents/user and Churn = 70.66% and hence LTV = 0.15
Behavioral
I can perform further analysis with the data set to analyze behavioral path for users making purchases or run a regression model to identify which factors drive users towards purchasing more coins and gold. It would be easier to perform the analysis if the times were available with the dates. Just looking at the profile of users making purchases, I have shared the histogram of the levels of the users when the purchases were made.
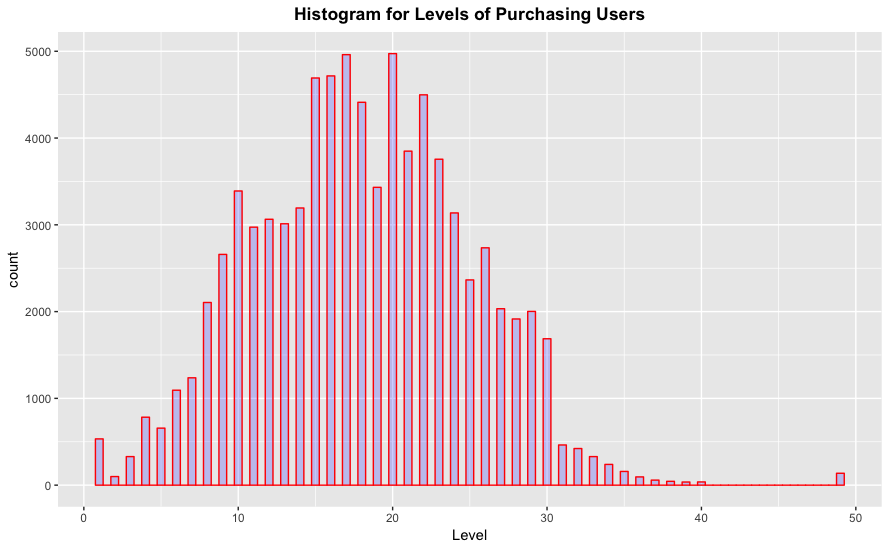
The purchases are higher for levels between 15 and 22. This could be an indicator that we should drive more users to reach these levels and concentrate on how to drive users higher than these levels to make more purchases.
Based on these graphs, what are some observations you have about how these metrics have fluctuated? What are some potential causes of the fluctuations / changes you identified in question (c)?
Some of the best performing gaming apps show a stickiness ratio of more than 30%. So, there is certainly room for improvement. The regression line shows a slight rise which indicates growth. Based on my limited research on what is considered a good retention rate, the numbers are on the lower side.
Looking at the DAU/MAU fluctuations across the 3 months, I noted that it is higher during weekends. This is understandable especially for an entertainment app to find more user activity during weekends. Adding new features, using push notifications and applying such other strategies can help improve engagement during the weekdays.